Human Geography
This class is offered online by Salt Lake Community College. The class studies human activity and spatial technology on a global scale. How humans effect our enviornment as well as how our enviornment influences human movement. Human Geography 1400 encourages students to think about connections between our enviornment and the contemporary issues in our world today.
Eportfolio Assignment-
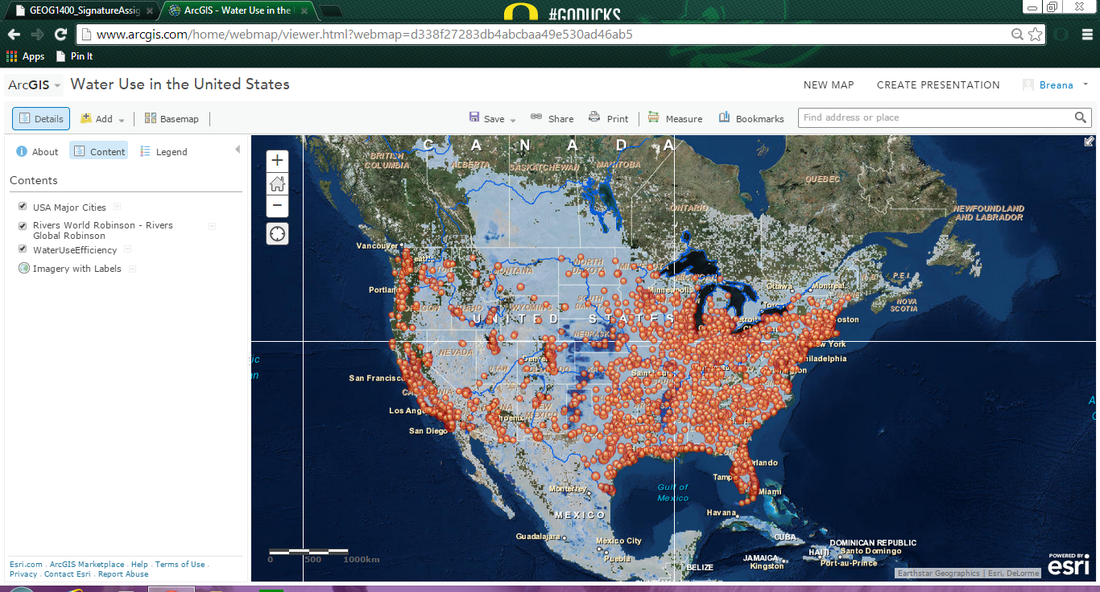
The web map I created “Water Use in the United States” is of the U.S. and Canada and their water usage across the continent. The map also includes various large cities, rivers, lakes and other natural water sources along with state and city labels. The Water Use Efficiency Layer is measured by million cubic meters and shows on the map as dark blue (high water use) to light blue (low water use) with white patched areas representing dry deserts. Rivers, lakes and other water sources are represented by blue lines and large cities are orange dots with varying circumferences representing population. By clicking on the orange “dots” you may see information on that city such as population, name and land use. The map spans across the U.S. and includes Hawaii for a total span of approximately 11,000 miles; including areas of the Pacific Ocean however does not include information on Alaska. The water usage is most concentrated in the Midwest and along the Mississippi, due to agricultural and farming use. The least amount of water use correlates with mountain ranges, extremely dry climates and national forests. The most largely used water source is the Mississippi and is the most visible as well. The most heavily concentrated cities are on the east coast and surround the Great Lakes; the western coastline also has some large cities. The least populated areas of the U.S. are within Montana, North Dakota, Nevada and South Dakota states. There are also many states without a large river running through their boundaries, mainly states in the South. As you zoom into the map the Water Use layer disappears and the United States Cities layer increases in detail and recognizes smaller cities. U.S. cities are showing a correlation between water availability and population growth because many of the largest populations are close to water. This map also shows how natural geography can act as borders between states. For example, the Rio Grande separates Texas from Mexico, the Columbia River separates Washington from Oregon and the Mississippi River separates many southern states from each other.
The map also includes water use and major river information for Latin America, Canada, South America, Africa, Europe, Asia and Australia if you zoom far enough away from the United States. America’s water use is comparably less than countries such as India and China; possibly due to population concentration. The cities layer however does not apply to the rest of the world and does not provide information on foreign populations. The information the map does provide however; indicates that South America has the most rivers and tributaries. In addition, Australia and Africa have the least amount of water usage, possibly due to their dry climate as well as conservation efforts. Last but certainly not least, the most interesting part of this map, both on the U.S. and across the world is the amount of information gathered and available to the public on water use, major rivers and water sources, basic geographic landscapes and populations.
Reflection:
My planned program of study is in Veterinary Sciences and animal health where geospatial technology could be very beneficial and transforming. Using this technology veterinarians and researchers alike can map and categorize outbreaks of animal related diseases and where the disease is affecting. In addition, mapping of certain carcinogens, risks, symptoms or related cases can help researchers and veterinary practices determine if other practices across the nation are dealing with the same disease. For example, Heartworm is a potentially life ending disease in dogs and cats that is most prevalent in the southern states, with geospatial technology, researchers can determine if known boundaries are changing and whether northern states need to pay more caution to testing. In large animal practices, herd cattle health and equine health could also be revolutionized by geospatial technology by mapping out the best grazing lands, ranches, crop and acreage. Vaccines are also very important in veterinary sciences and also rely on gathered information to determine expiration, dose and frequency which would also be more reliable with geospatial mapping. Many veterinary practices are small businesses, mapping their location can increase availability to clients, increase their revenue and decrease medication, stocking and medical costs for the veterinarian. Last but not least, the already widely used microchip for pet tracking could also be used in conjunction with geospatial technology to combat overcrowded shelters and unwanted animals by mapping out the most concentrated kill shelters and incorporating more vigorous spay and neuter campaigns.